
April 2021 is a Seller's market!
The number of for sale listings was down 49.6% from one year earlier and down 5.7% from the previous month. The number of sold listings increased 8.1% year over year and decreased 38.8% month over month. The number of under contract listings was up 16.8% compared to previous month and up 14.9% compared to previous year. The Months of Inventory based on Closed Sales is 0.7, down 51.9% from the previous year.
The Average Sold Price per Square Footage was up 0.3% compared to previous month and up 20.6% compared to last year. The Median Sold Price increased by2% from last month. The Average Sold Price also decreased by 0.8% from last month. Based on the 6 month trend, the Average Sold Price trend is "Depreciating" and the Median Sold Price trend is "Neutral".
The Average Days on Market showed a neutral trend, a decrease of 40.8% compared to previous year. The ratio of Sold Price vs. Original List Price is 100%, an increase of 3.1% compared to previous year.
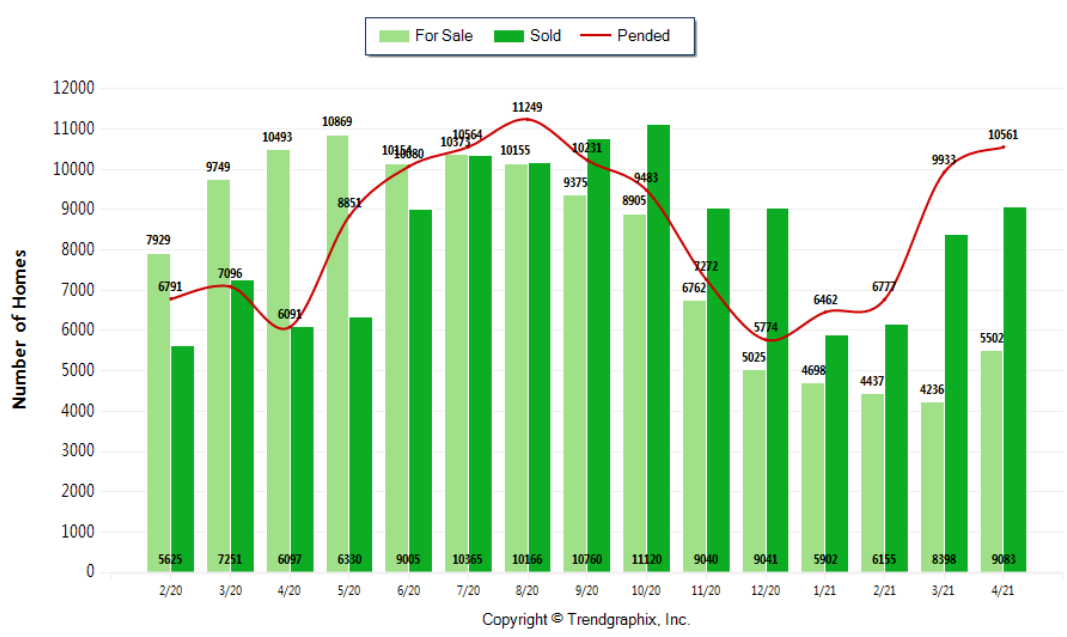
Property Sales (Sold)
January property sales were 4919, up 8.1% from 4549 in January of 2020 and38.8% lower than the 8035 sales last month.
Current Inventory (For Sale)
Versus last year, the total number of properties available this month is lower by3482 units of 49.6%. This year's smaller inventory means that buyers who waited to buy may have smaller selection to choose from. The number of current inventory is down 5.7% compared to the previous month.
Property Under Contract (Pended)
There was an increase of 16.8% in the pended properties in January, with 5993properties versus 5132 last month. This month's

Finally, some good news for home buyers! Sizeable increases in new listings compared to a year ago and reports of moderating prices might mean we are seeing some relief for buyers. On the latest statistics, summarizing April activity, the market remains hot while emphasizing active listing numbers do not always reflect actual overall activity.
With a market like this, and the velocity of new listings moving to pending status, active listing data tend to get more attention. At month end, April’s active listings stood at 5,616, yet during the month, member-brokers added 12,043 new listings of homes and condos. A jump of more than 57% from the same month a year ago when the pandemic shutdown began. Compared to March, the volume of new listings rose 14%, and even compared to two years ago (April 2019), new listings were up about 3%. April’s month-end inventory of 5,616 listings was a year-over-year (YOY) drop of 45%; a year ago, there were 10,282 active listings in the MLS database. Pending sales continue to surge, keeping inventory depleted. Brokers reported 10,583 pending sales during April, up nearly 47% from a year ago when they logged 7,207 mutually accepted offers. Last month’s pending sales dipped slightly (2.58%) from March.
At long last, May is here. Historically, we see a nice uptick in new listings every May. This increased availability and selection will be present throughout the summer, this prediction by noting there is a large backlog of prospective home buyers, a situation will keep the market in a state of ‘instant response’ for each new resale listing. It has been noted 16 of the 26 counties in the report had at least a 20% increase in active listings at the end of April compared to March, which is some good news for buyers! Active listings increased by 1,463 properties (up 35.2%). It was also pointed out the rise in inventory had a softening effect on the average listing price. The calculations drop of 5.1% between March and April. It’s too early to suggest this trend will continue, but it’s encouraging to see and hopefully the beginning of a shift back towards a more balanced market.
Even with some improvement in listings, the MLS report shows only nine counties have more than one month’s supply of inventory. Area wide, there is only 0.64 months of inventory, with even less supply (0.57 months) in the four-county Puget Sound region. Many analysts consider a balanced market to be in the four-to-six-month range. With supplies depleted, prices continue to climb. Brokers reported 8,791 closed sales of single family homes and condos during April, nearly 50% higher than the year-ago total of 5,866 completed transactions. Year-over-year prices on closed sales surged 25%, from $452,030 to $565,000. Nearly every county had double-digit gains. Prices on single family homes rose about 26.5%, while condo prices increased by a more modest 12%. As long as housing supply remains constrained and interest rates remain low, these price trends continuing well into the summer. It is expected that continued price increases along the I-5 and I-90 corridors and noted peripheral areas are continuing to outperform as people seek value in a low interest rate environment.

Kitsap County and the Olympic Peninsula are experiencing vigorous activity from would-be buyers from the Seattle/King County area who are looking for “safety, community, affordability, and choices.” Also, it has been cited the area’s low unemployment rate and robust economy as market drivers. Inventory in Kitsap County has not expanded at anticipated rates. Builders are perplexed with new regulations, increasing costs of construction materials, and increased bureaucratic overlays. The volume of new listings (including single family homes and condos) in Kitsap County increased 47.4% from a year ago and nearly 17% from March, but total active inventory was down 47% from a year ago, resulting in about two weeks of supply (0.57 months). There has been an estimated 80% of sales in Kitsap County exceeded listed values, with “many buyers making the buying decision from a virtual tour.” Year over-year prices rose 22.7%, with the median price on last month’s sales, at $485,000, significantly lower than King County where it was $750,000.
Intense competition is causing buyers and sellers to consider shortening offer review dates. Sellers with offer review dates within five to seven days of the listing date are receiving strong offers on day one or day two of listing. Some sellers are considering offers with no contingencies and aggressive prices. Although bidding wars are common, some brokers are reporting things may be starting to moderate related to pricing. Some sellers who have been pushing the envelope on their home price are now experiencing longer list times and, in some cases, have had to drop their prices. It’s emphasized that sellers need to price appropriately. With things starting to return to normal, the off-the-chart activity placing sellers in the driver’s seat may be moderating. The real estate market was the cornerstone of the US economy during the darkest days of the pandemic, and things are not changing as we return to normalcy. It’s still very tough for buyers. The value used to be what the comparable properties sold for. Now it’s whatever the buyer is willing to pay, which is almost always more than the list price. Although inventory remains a challenge, there may be hope on the horizon as we head into the prime-time months for sellers.
Condominiums may be an option for some house-hunters. Database shows 1,127 current condo listings with prices on these offerings ranging from $75,000 for a listing on a golf course in Adams County to $13.5 million for a penthouse on First Hill in Seattle. Condo supply remains tight at 0.88 months (down 27% from a year ago), with prices up 12% area wide. In King County, where nearly three-fourths of current inventory is situated, year-over-year prices increased about 7%. It is interesting to note a continued decline in King County’s condominium inventory – down from nearly 1.6 months of supply in January -- perhaps marking a return to the urban markets with increased vaccinations. The MLS report for April shows pending sales of condos for the map areas encompassing Seattle spiked nearly 184% from a year ago, from 135 units to 383. Condo’s are increasingly popular with millennials with 47% of all condo mortgage applications submitted by millennials in 2019. Research by the National Association of Home Builders (NAHB) indicates improving perceptions about the availability of homes among some buyers, and especially among millennials, the largest share of home buyers. In its latest Housing Trends Report, NAHB reported the share of millennial buyers who expect housing availability to ease up in the months ahead rose decisively between the first quarters of 2020 and 2021, from 26% to 42%.


Is 2021 Going To Be A Housing Bubble? What is the Market Going To Do? Forbearance? Foreclosures in the Millions? Watch the Full Video to know more.
For more Real Estate News and Advice, please tune in to our Facebook live every Saturday at 10AM
Follow us on Facebook: George Moorhead Bentley Properties
If you have any questions or comments you would like answered in next month's newsletter, email me at [email protected] and they will be included in the market update. OR if you would like more information on our unique systems and programs, call us at 425-236-6777 Or visit our website www.GeorgeMoorhead.com


©2021. All rights reserved
GEORGE MOORHEAD - Bentley Properties
[email protected]
Direct: 425-236-6777
14205 SE 36th St., Suite 100, Bellevue WA 98006
www.GeorgeMoorhead.com